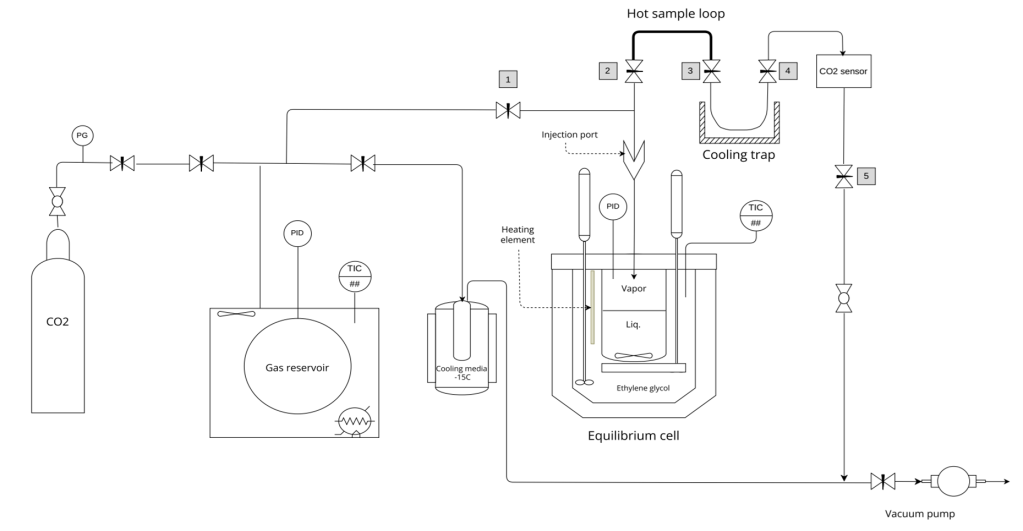
The equipment employs the static method to yield xP(T)-data. A novel approach greatly simplifies the tedious degassing process associated with this procedure.
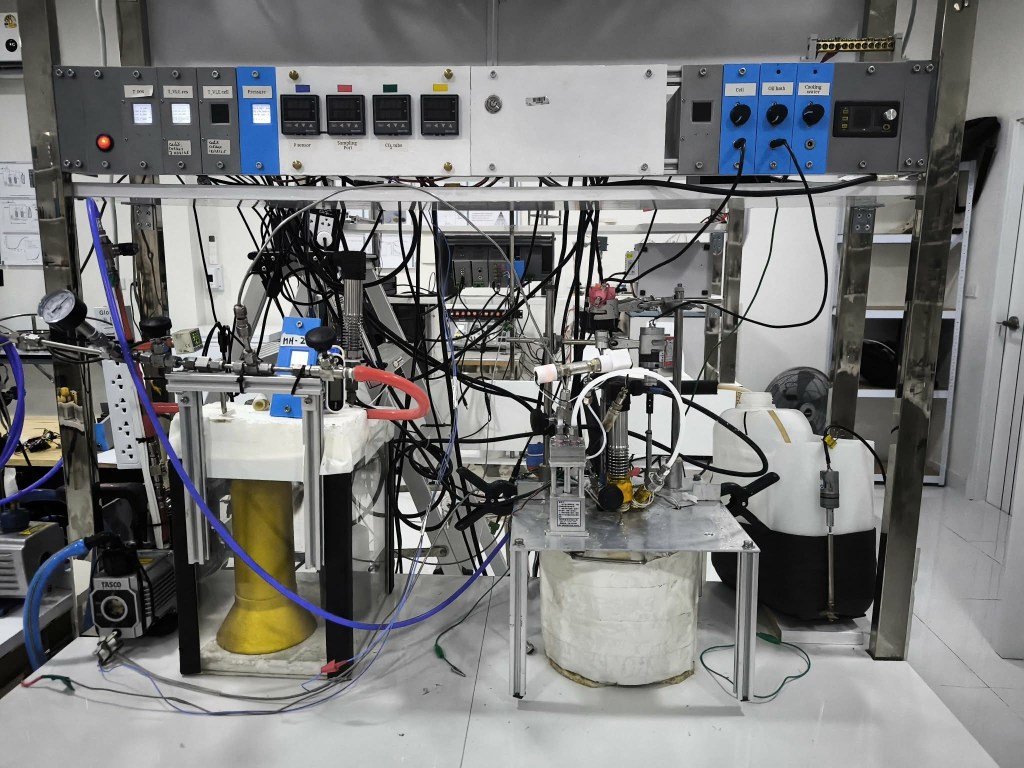
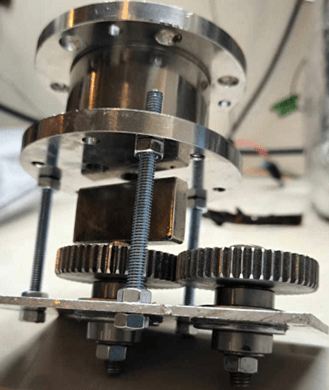
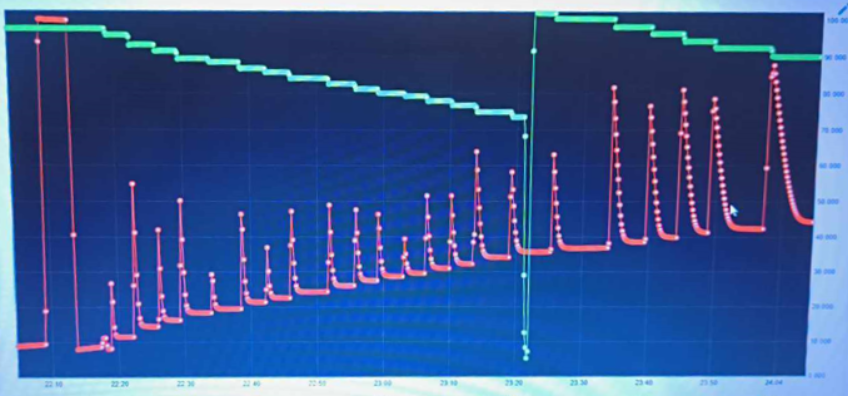
The photo below shows a complete measurement. The red curve represents the equilibrium cell pressure and the green curve the pressure in the gas reservoir. Whenever gas is injected into the equilibrium cell the reservoir pressure declines and the cell pressure increases. At a certain point, the reservoir pressure is increased by loading it with gas from the tank. Degassing of the initial solvent charge is performed in-situ by repeated freezing-evacuation cycles.
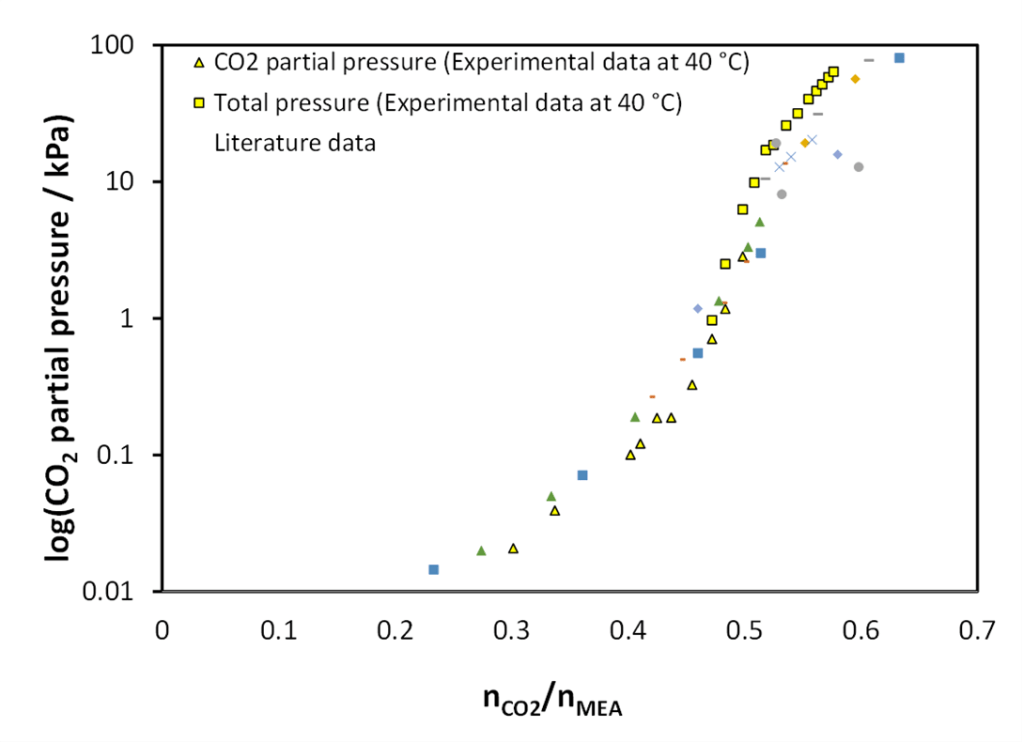
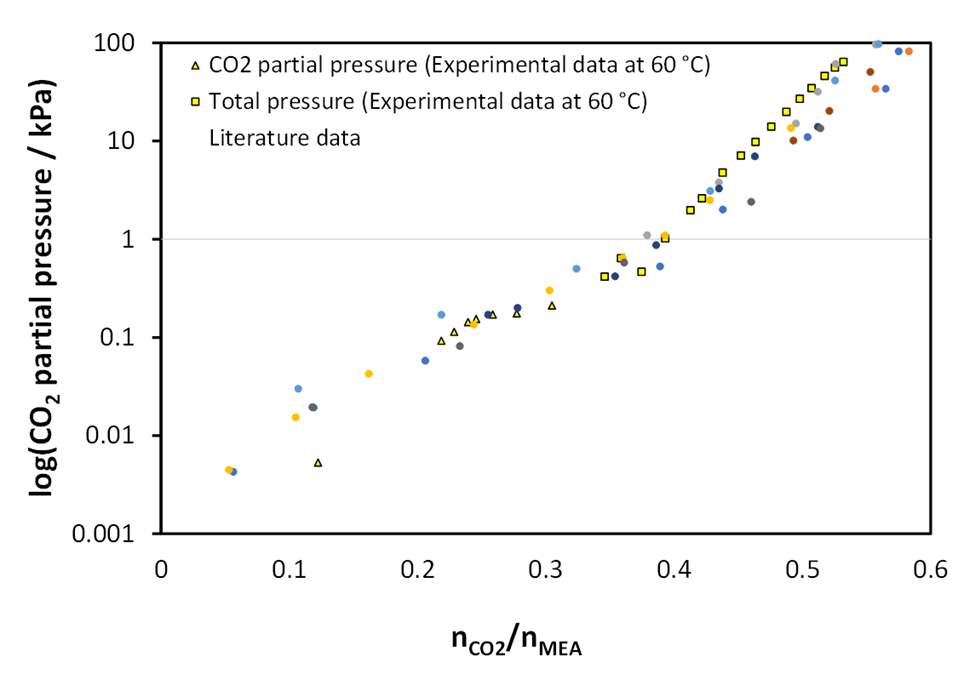
Using this equipment, several isotherms for the solubility of CO2 in 30 w% MEA-water were measured. The triangles are results of spectroscopic determination of CO2 in the vapor phase using an NDIR sensor.